Getting Support
Please use the appropriate channel to request support – customers should file a support ticket or work directly with their Customer Success Manager, for everyone else, there’s Stardog Community.
Reporting an Issue
When reporting an issue, please include the following information:
- A complete description of the problem you are having. This includes describing the expected behavior, as well as the observed behavior in as much detail as possible.
- The zip file created when running the CLI command
stardog-admin diagnostics reportfor single node deploys.- If you are unable to run the this command, please include the log file.
- See the cluster issues section for additional information required when reporting cluster issues.
- If your question is related to a particular database, please include the output of the
metadata getStardog Admin CLI command:
stardog-admin metadata get <yourDatabaseName>
- Other information as you are able:
- Approximately when you hit this issue (so we can reference in the logs)
- Your Stardog version
- Your operating system and any other system info
- Which JVM you are using
Query Performance Issues
When reporting a query performance issue, please include the following information:
- The query and its associated query plan. Please always copy the plain text version of the plan into an attachment and do not take screenshots of visual plans in Stardog Studio. To obtain a query plan:
-
Use the
query explainCLI command.stardog query explain myDatabase "SELECT ?title WHERE { <http://example.org/book/book1> <http://purl.org/dc/elements/1.1/title> ?title . }"You can optionally save the query into a file and provide the path of the file to the command like so:
stardog query explain myDatabase ~/queries/myQuery.rq -
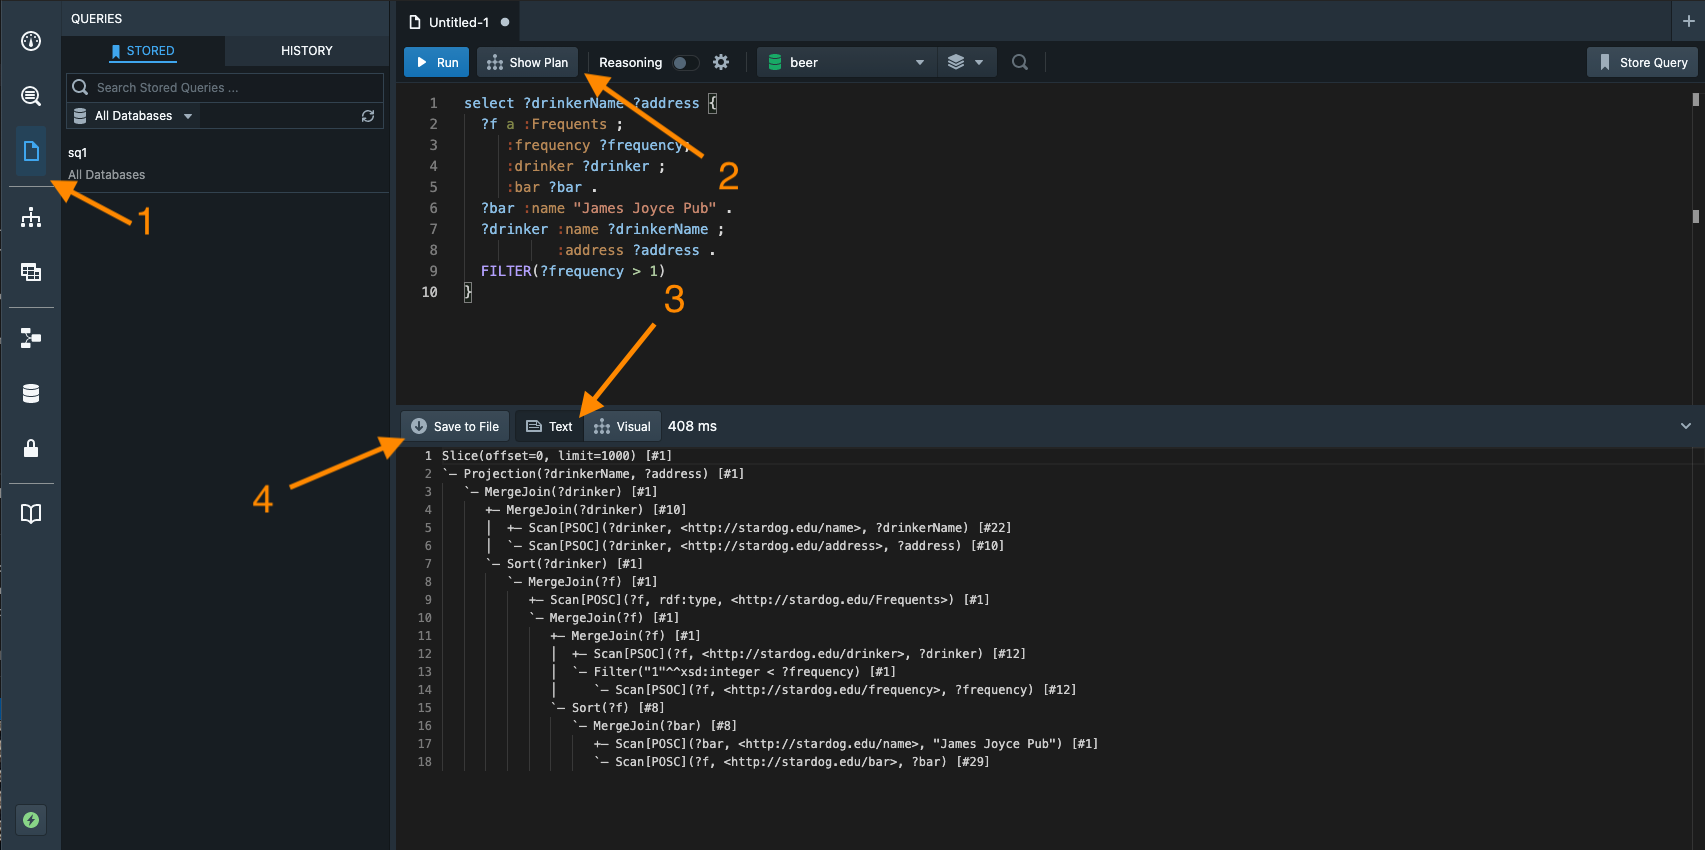
Go the “Workspace” tab in Studio and open up your query in the editor. Click on the “Show Plan” button. By default, the visual studio query plan will be shown. Please toggle the query plan display options from “Visual” to “Text”. From here, you can either click the “Save to File” button to save the query plan to a file or just copy the text to a plain text file.
- If you are reporting a regression in query performance between versions, please share the query plans for the problematic query from both versions.
- If the query is a SPARQL Update query, the query plan is not very useful because update query planning is done during query execution, not prior to it. Please convert the query to a
CONSTRUCTwhich uses the sameWHEREpattern and the same graph template asINSERT(orDELETE) and include the query plan for that. - If you have a long running query or a query that fails to terminate after manually killing it, it’s best to additionally collect metrics while the query is running or “stuck” in the “Terminated” state. To collect server metrics, execute the
server metricsStardog Admin CLI command with the--threadsflag:
stardog-admin server metrics --threads > server_metrics.out
- If the query is only slow when reasoning is enabled, it’s helpful to share the schema, if possible. Your reasoning schema can be exported using the CLI with the
reasoning schemacommand:
stardog reasoning schema -f pretty_turtle myDatabase > reasoning_schema.ttl
The above command can be modified to export the reasoning schema if it resides in a named graph and not the default graph. See the reasoning schema manual page for more examples.
Cluster Issues
To gather logs and system information in a cluster generate the cluster diagnostics zip with stardog-admin cluster diagnostics-report
This command requires a running cluster to gather the report from any participating nodes. If there are nodes that have been expelled from the cluster you must gather this information manually.
In addition to the information described in Reporting an Issue and the cluster diagnostics zip please also try to gather the following:
- ZooKeeper logs from all ZooKeeper nodes
- Description of how Stardog was installed: zip, packages, Docker, helm charts in Kubernetes
- A list of any running queries and query plans (if applicable)
- Output of
zk info:
stardog-admin zk info
If Stardog is running in Kubernetes, please also provide:
- The command being used to deploy Stardog (e.g.,
helm install) and any custom values defined invalues.yaml - Output of the following commands:
kubectl -n <your namespace> get pods
kubectl -n <your namespace> describe pod <pod> # for each Stardog and ZooKeeper pod
kubectl -n <your namespace> get events --sort-by=.metadata.creationTimestamp
Logs
Stardog Platform
The logs for the Stardog platform are stored in the stardog.log file within your STARDOG_HOME directory.
Studio
Studio’s logs are available at different paths depending on your OS:
| OS | Path |
|---|---|
| MacOS | ~/Library/Logs/``Stardog\ Studio``/log.log |
| Windows | %USERPROFILE%\AppData\Roaming\``"Stardog Studio"``\log.log |
| Linux | ~/.config/``Stardog\ Studio``/log.log |
| Browser | Log messages are written to the browser’s console. If reaching out for support, please share recent browser console messages |