Data Visualization with D3.js
Learn how to build custom data visualization for Stardog with D3.js.
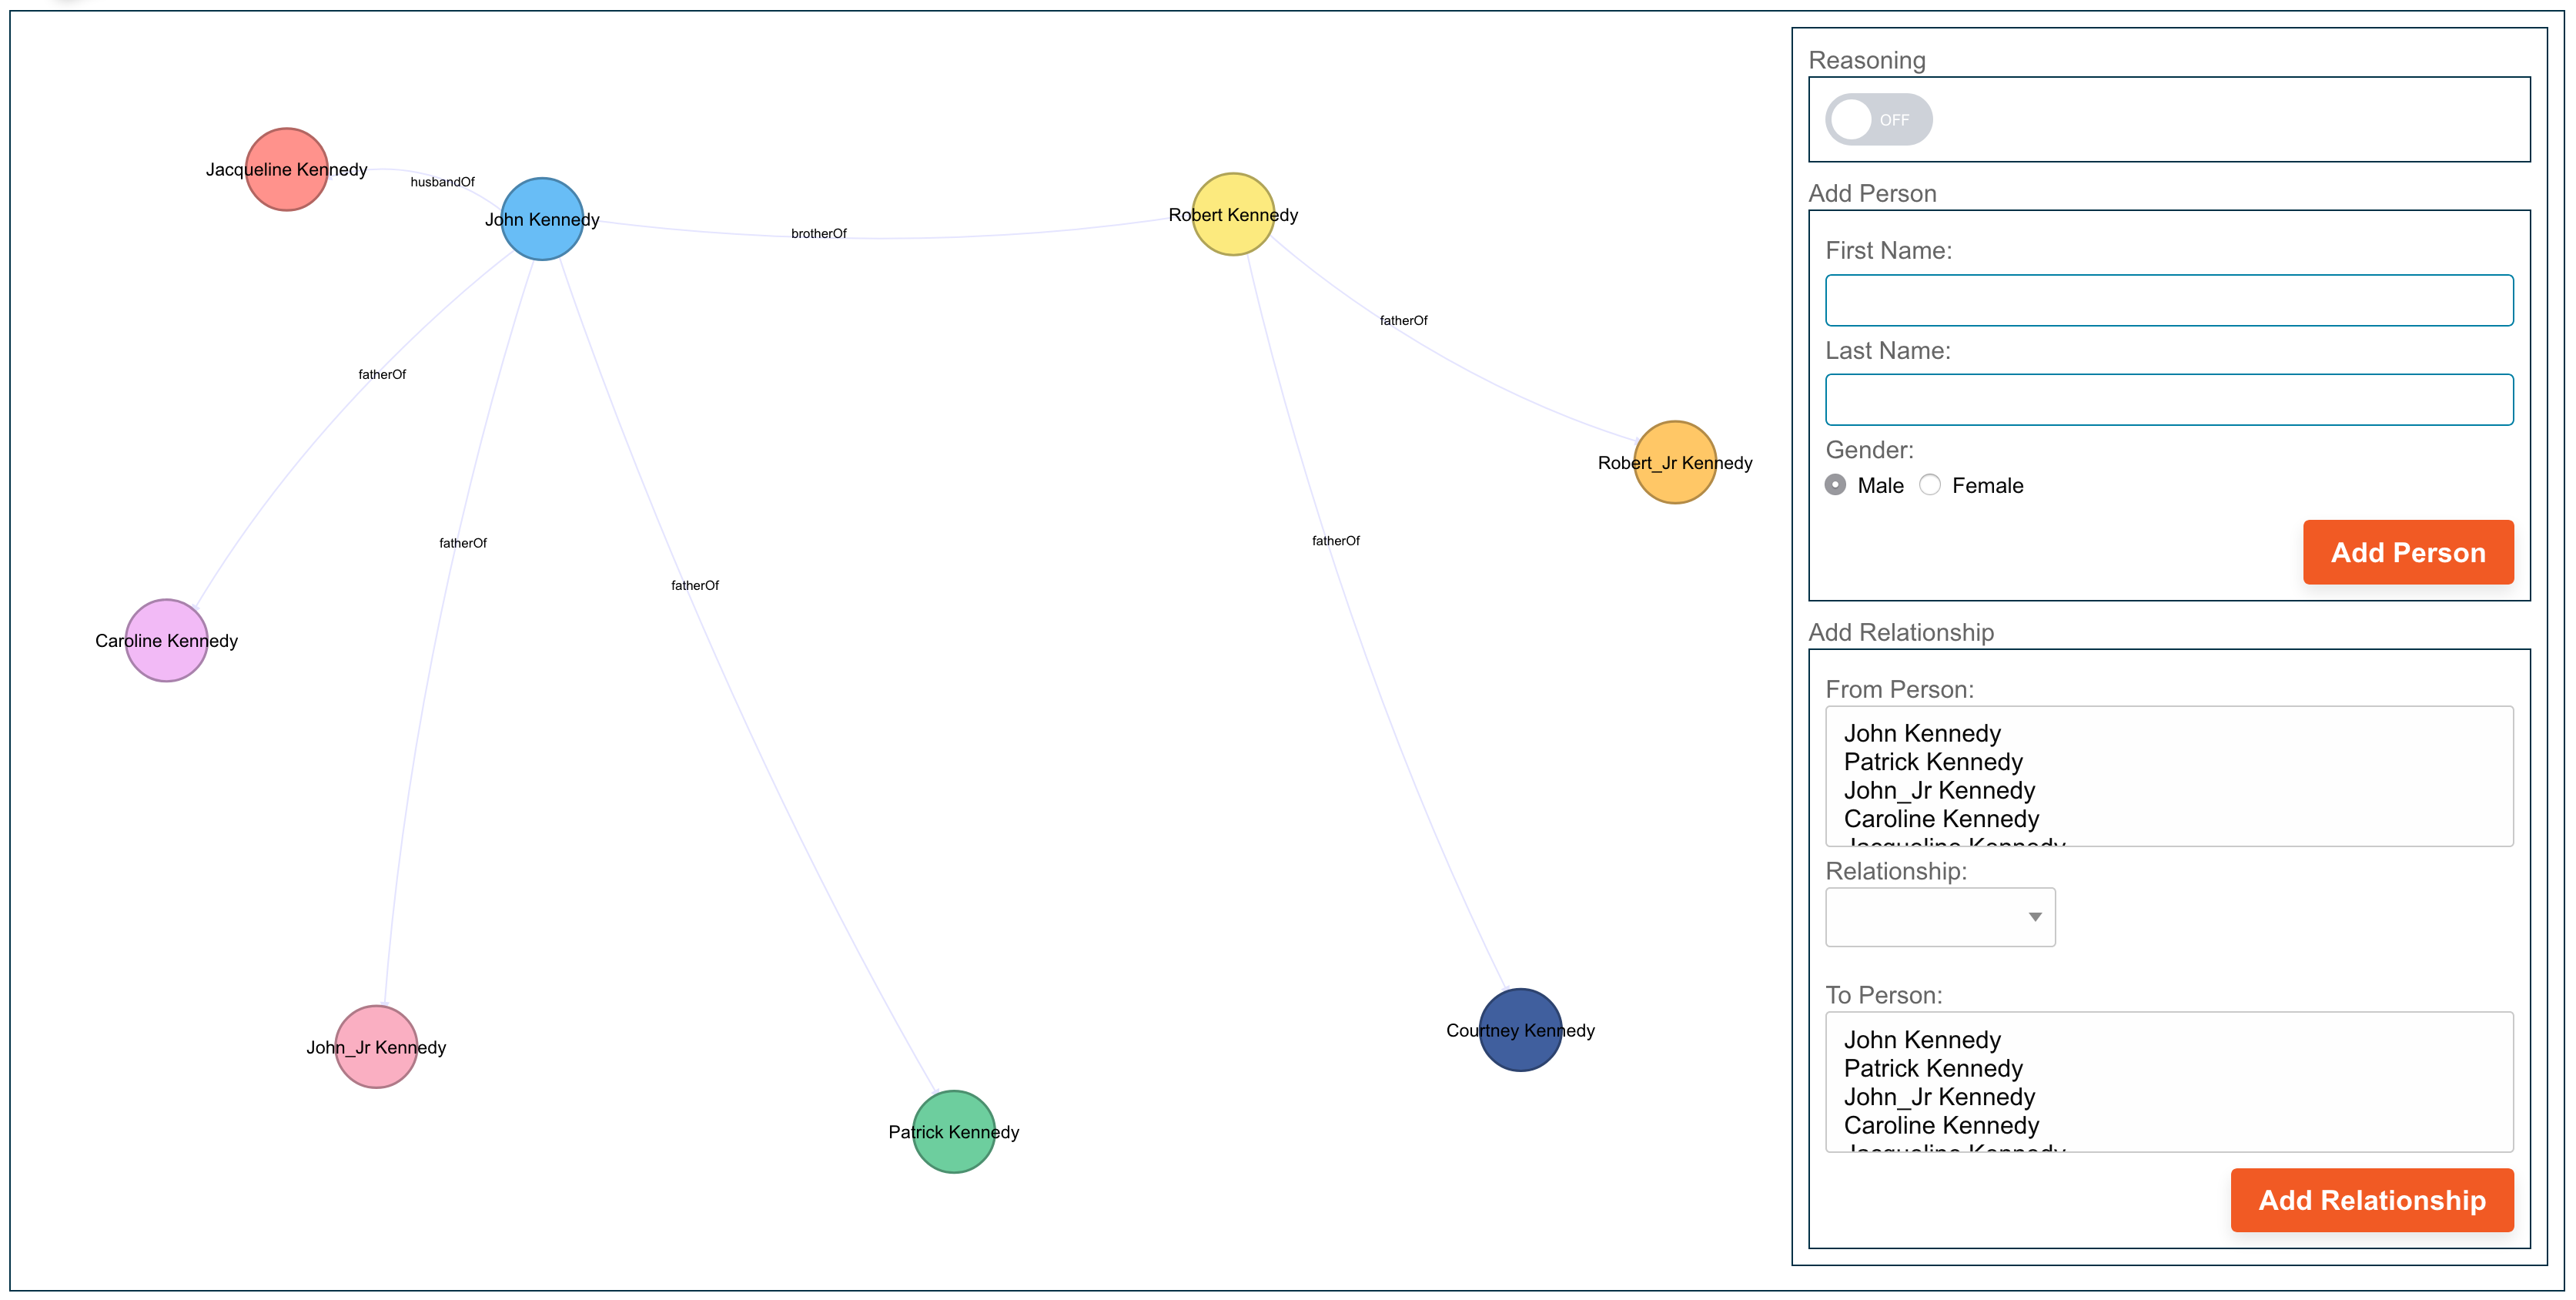
You have unified data. Where do you go from here? A core use case is to show a directed graph visualization of relationships in the data. For this, we’re going to explore the D3.js library with Stardog.
Understanding D3.js
D3.js is a JS library for manipulating documents based on data. Developers use a fluent API to manipulate documents and generate interactive visualizations using HTL, SVG, and CSS. Rather than express direct representations, D3 provides a transformation API that allows you to control transformations and animations via easing functions such as “elastic”, “cubic-in-out” and “linear”. D3’s interpolators support both primitives, such as numbers and numbers embedded within strings (font sizes, path data, etc.), and compound values. You can even extend D3’s interpolator registry to support complex properties and data structures.
In this post, we’ll focus on the D3 force directed graph library, its features, and how a Stardog model can easily integrate with it. There are other parts of D3 that can be used, including charts, lists, and trees.
The force directed graph is going to manipulate an SVG, providing a list of nodes, a list of relationships between nodes, and then a series of transformations applied that will result in the rendering of the visualization. Rather than compute your own layout of nodes in a graph and lines connecting them, D3 offers a force simulation algorithm that generates the layout. Like in all things D3, developers can apply transformations to speed up the layout rendering, group things together, or customize specific behavior.
The force simulation will look at each node, and go through a series of ticks until equilibrium is reached and the simulation has come to an end. User interface features such as clicking, expanding nodes, dragging items around, etc. can restart the simulation and apply transformations; for example, when you click a node in the graph and expand all of the known edges and introduce new nodes into the SVG.
Finally, each node can be manipulated in the D3 API, allowing you to apply styles and attributes to the DOM element. So, when we want a circle, we’re going to apply the styles and DOM attributes to make a circle on the screen.
Ok, this all sounds complicated: entering nodes, applying styles to individual elements to render SVG. We haven’t even talked about data yet. We will guide you through building an application quickly, bundling up these common transformations into a reusable class with callbacks for specializing the behavior to your application’s needs.
Stardog and D3 Example
We’ve put together a library, StardogD3, that simplifies this down to a query and set of behaviors to build the visualization. Since D3 wants a Hash table consisting of nodes and their relationships, let’s start there. We can use SPARQL, PATH queries, or GraphQL to find this information, and then the JavaScript callback will put it in the right form for consumption in D3. We’ll also showcase this in React, using the latest version of stardog.js with support for Promises to have a complete reactive demo application.
Let’s start with using stardog.js with GraphQL to find a series of nodes with some data and store some states. As you can see below, the response is directly consumable, and we set it as a property on our component.
let nodeQueryStr = 'query \n' +
   '   withAliases @config(alias: {person: "http://api.stardog.com/Person"}) {\n' +
   '       person {\n' +
   '           firstName: stardog_firstName,\n' +
   '           lastName: stardog_lastName,\n' +
   '           gender: stardog_gender,\n' +
   '           id @bind(to : "CONCAT($firstName, \'_\', $lastName)")\n' +
   '           label @bind(to : "CONCAT($firstName, \' \', $lastName)")\n' +
   '       }\n' +
   '   }';
stardogjs.query.graphql.execute(graphQLConn, 'stardogDemo', nodeQueryStr,
   { "@reasoning": false }
).then(({body}) => {
   this.setState({nodesLoading: false});
   if (body && body.data.length > 0) {
       this.nodes = body.data;
   }
}).catch((err) => {
   this.setState({nodesLoading: false});
   return Promise.reject(err);
});
This retrieves just the nodes, as there may be items in the graph that have no edges we care about, but still want to show that disjoint relationship. To get the relationships, we’ll show a SPARQL query. Notice in the below snippet how we’ll need to map the result set into the D3 form and include a link type.
let edgeQueryStr = 'select ?source ?target ?linkType where { \n' +
   '    ?linkType rdfs:subPropertyOf :linkType . \n' +
   '    ?s ?linkType ?t .\n' +
   '    ?s stardog:firstName ?sfn .\n' +
   '    ?s stardog:lastName ?sln .\n' +
   '    ?t stardog:firstName ?tfn .\n' +
   '    ?t stardog:lastName ?tln .\n' +
   '    BIND (concat (?sfn, \'_\', ?sln) AS ?source) .\n' +
   '    BIND (concat (?tfn, \'_\', ?tln) AS ?target) .\n' +
   '    FILTER (?linkType != :linkType) \n' +
   '}';

stardogjs.query.execute(standConn, 'stardogDemo', edgeQueryStr, 'application/sparql-results+json',
   {
       reasoning: this.props.useReasoning
   }
).then(({body}) => {
   if (body && body.results && body.results.bindings && body.results.bindings.length > 0) {
       this.edges = [];
       if (!_.isEmpty(body.results.bindings)) {
           body.results.bindings.forEach(e => {
               this.edges.push({
                   source: e.source.value,
                   target: e.target.value,
                   linkType: e.linkType.value.substring(e.linkType.value.lastIndexOf('/') + 1, e.linkType.value.length),
                   id: `${e.source.value}_${e.linkType.value}_${e.target.value}`
               });
           });
       }
   }
   this.setState({edgesLoading: false});
}).catch((err) => {
   this.setState({edgesLoading: false});
   return Promise.reject(err);
});
The linkType is of value here, since we’re going to add labeling to the edges in the visualization. The links are in the form of a URI, so we’ll strip out the bulk of that for a label. Applications that care about only specific relationships could easily use some other mechanism, like a lookup table or configuration map to render different labels, colors, line weight, etc.
For completeness sake, we could have also used a PATHS query to find the same Information. Below is an example PATHS query:
PATHS ALL start ?x = urn:parentNode END ?y
VIA { ?x ?p ?y . ?y a ?t . ?y dc:title ?title . }
MAX LENGTH 1
With both of these queries hooked into React, we’ll use the componentDidMount to invoke the initial query to display the d3 visualizations:
componentDidMount() {
   this.setState({
       edgesLoading: true,
       nodesLoading: true
   });
   this.performQuery();
}
Next, the shouldComponentUpdate determines if the GraphView component should update and rerender the div that holds the D3 SVG canvas.
shouldComponentUpdate(nextProps, nextState) {
	return !!nextProps.shouldUpdate
	|| !_.isEqual(this.state, nextState);
}
Finally, the componentDidUpdate initializes the D3 library or executes the queries. A query will get executed if the shouldUpdate property is set to true. If not, it will initialize the D3 library and send the data.
componentDidUpdate() {
   if (this.props.shouldUpdate) {
       this.setState({
           edgesLoading: true,
           nodesLoading: true
       });
       this.performQuery();
   } else {
       if (!this.state.edgesLoading && !this.state.nodesLoading) {
           let vizData = {
               nodes: this.nodes,
               relationships: this.edges
           };
           if (!this.stardogd3) {
               this.stardogd3 = new StardogD3('#stardogd3', {
                   minCollision: 60,
                   stardogData: vizData,
                   infoPanel: false,
                   nodeRadius: 25,
                   relationshipColor: "blue",
                   relationshipOpacity: .1,
                   showRelationshipTitles: true,
                   relationshipIcon: 'arrow',
                   showRelationshipCurvedEdges: true,
                   alwaysShowCurvedEdges: true,
               });
           } else {
               this.stardogd3.updateWithStardogData(vizData)
           }
       }
   }
}
In this example we have the state transition handled, configuring D3 on the first call with number of collisions the force simulation will run, the radius of the circles that will get rendered, and other display attributes. Finally, the updateWithStardogData callback is present for passing in the node and relationship table that we pulled in earlier. In a non-reactive application, the callback could run the SPARQL queries directly.
Putting It All Together
The main addition to the canvas manipulation described above is showing how to integrate form handlers to trigger the lifecycle events.
We can collect data or apply filters, and update the graph view as appropriate.

To accomplish this, we start by adding a new React component that looks for a change in properties and then updates the graph properties. This lifecycle mapping pattern in React enables us to focus on the data, and separate the concerns of D3 from UI controls. The contract between the form and the graph view is, then, just those data items that they share.
class AddRelationship extends React.Component {
	constructor(props) {
        super(props);
        this.state = {
            personOptions: [], edgeOptions: [], fromPerson: '', toPerson: '',
            relationship: '', error: '', showError: false, updateRelationships: false,
        };
    }

    // Pulls the relationships from Stardog
    getRelationships() {
        stardogjs.query.graphql.execute(graphQLConn, 'stardogDemo',
            'query ' +
            '   withAliases @config(alias: {person: "http://api.stardog.com/Person"}) {' +
            '       person {' +
            '           firstName: stardog_firstName,' +
            '           lastName: stardog_lastName ' +
            '       }' +
            '   }',
            {"@reasoning": true}
        ).then(({body}) => {
            if (body && body.data.length > 0) {
                        let newOptions = [];
                        body.data.forEach(p => {
                            newOptions.push(<option key={`${p.firstName}_${p.lastName}`} value={`${p.firstName}_${p.lastName}`}>{`${p.firstName} ${p.lastName}`}</option>);
                        });

                        this.setState({personOptions: newOptions})

        }).catch((err) => {
            return Promise.reject(err);
        });

        let queryStr = 'select ?linkType where { \n' +
            '    ?linkType rdfs:subPropertyOf :linkType . \n' +
            '}';
        stardogjs.query.execute(standConn, 'stardogDemo', queryStr, 'application/sparql-results+json', {reasoning: false}).then(({body}) => {
            if (body && body.results && body.results.bindings && body.results.bindings.length > 0) {
                let newOptions = [];
                body.results.bindings.forEach(p => {
                    let relationship = p.linkType.value.substring(p.linkType.value.lastIndexOf('/') + 1, p.linkType.value.length);
                    newOptions.push(<option key={relationship} value={relationship}>{relationship}</option>);
                });

                this.setState({edgeOptions: newOptions})
            }
        });
     }

    // Calls the passed in props function to add a new relationship
    handleClick = () => {
      if (!this.state.fromPerson || !this.state.toPerson || !this.state.relationship) {
          this.setState({
              error: this.allDataError,
              showError: true
          });
      } else if (this.state.fromPerson === this.state.toPerson) {
          this.setState({
              error: this.samePerson,
              showError: true
          });
      } else {
          this.setState({
              error: '',
              showError: false
          });
          this.props.addRelationship({
              fromPerson: this.state.fromPerson,
              toPerson: this.state.toPerson,
              relationship: this.state.relationship})
      }
    };
A filter button is even easier, as filters will typically modify the query to Stardog. In those cases, we need only identify the property we want and expose it to the UI.
class Reasoning extends React.Component {
	onChange = (event) => {
		this.props.updateReasoning(event.target.checked);
	};
	render() {
		return (
		 <div>
		  <div>Reasoning</div>
		  <div className="consoleBorder personForm">
		   <label className="switch">
		    <input type="checkbox" id="togBtn" onChange={this.onChange} />
		    <div className="slider round">
	  	     <span className="on">ON</span>
		     <span className="off">OFF</span>
		    </div>
		   </label>
		  </div>
		 </div>
		);
	}
Then, our stardog.js calls can pick up this parameter:
stardogjs.query.execute(standConn, 'stardogDemo', queryStr,
     'application/sparql-results+json',
     {reasoning: this.props.useReasoning})
In the end this demo application shows assembling a graph view without getting into low level d3.force calls, or building callback functions. We took advantage of React lifecycle events to standardize on properties of the application, and manipulate which queries run. Our query results turned into more application properties that we relied upon React to update the D3 aware component.
This isn’t the only way to integrate D3 into an ecosystem, but we found it to strike a good balance between separation of concerns and flexibility of implementation.
Summary
In this tutorial we looked at how applications can be built using stardog.js, D3, and the different ways to query Stardog along the way. The full example is available in the stardog-examples repo. You can read more about GraphQL support and path queries in Stardog.