Stardog Unit Usage Reporting
This page discusses the Stardog Unit usage dashboard and reporting feature, which allows users to monitor and export Stardog Unit (SDU) consumption data for their endpoints.
Page Contents
Overview
A Stardog Unit (SDU) is a measure of compute time consumed while using the Stardog platform. 1 second of compute time = 1 Stardog Unit. SDUs are tracked across the following activities:
- Query execution: All read queries (SELECT, CONSTRUCT, ASK, DESCRIBE, PATHS, VALIDATE) run from Studio, Explorer, or via the API, including scheduled query triggers
- Voicebox interactions: All questions run across both the UI and API
- Model generation: AI-assisted model and mapping generation in Designer
- Document processing: Spark-based document processing and external compute tasks
The following activities are excluded from SDU tracking:
- Update queries: All SPARQL UPDATE operations (INSERT, DELETE, ADD, COPY, MOVE, CLEAR, DROP, CREATE, LOAD) are excluded regardless of complexity
- Failed queries: Queries that did not complete successfully (timed out, killed by user, or threw an exception) are not counted
- Voicebox queries: The underlying SPARQL queries that Voicebox generates and executes are not tracked separately to avoid double counting. Voicebox questions are tracked as a single unit of work.
- System queries: System database queries generated by Studio or Explorer (e.g., schema lookups, metadata retrieval)
Stardog Unit usage reporting provides visibility into how many units an endpoint consumes over time and allows you to monitor consumption patterns and export raw data for internal billing, chargeback, or capacity planning purposes.
Key capabilities:
- Dashboard UI: Interactive view of consumption across an organization
- CSV Export: Provides downloadable consumption report per endpoint
- Multi-User Support: Aggregates usage across all users and Stardog processes for a comprehensive view of endpoint consumption
- Daily Aggregation: Sums SDU usage for each endpoint every 24 hours
Stardog Unit Dashboard
The SDU Dashboard provides an interactive view of Stardog Unit consumption across your organization’s endpoints. It is viewable by all members of the organization.
The dashboard exists at two levels:
- Organization-level view: aggregates SDU consumption across all endpoints in your organization.
- Endpoint detail view: a drill-down page for a single endpoint, accessed by clicking on hyperlinked endpoints in the organization-level table.
Accessing the Dashboard
The organization-level dashboard can be found by clicking the Stardog Units summary card in the Organization home page.
Organization-Level View
The org-level dashboard includes the following components:
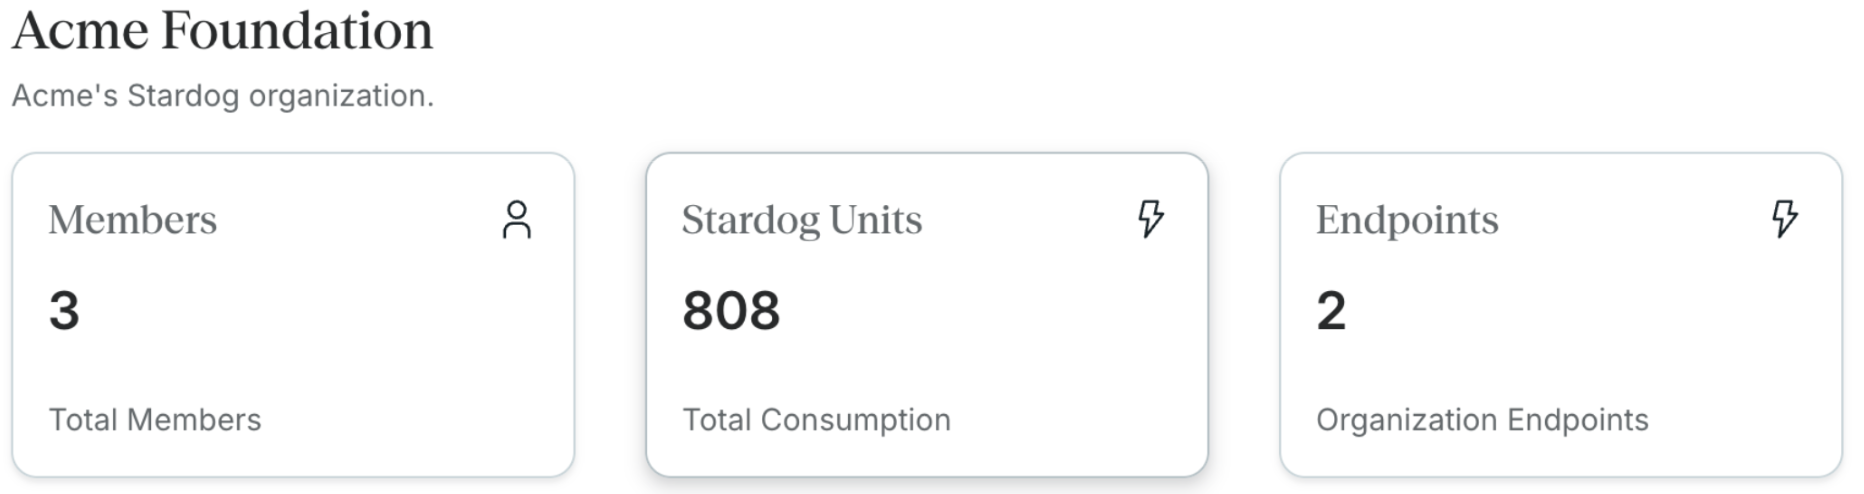
Two summary cards appear at the top of the page:
- Stardog Units: total SDUs consumed across all endpoints owned by your organization
- Connected Endpoints: the number of endpoints currently owned by your organization
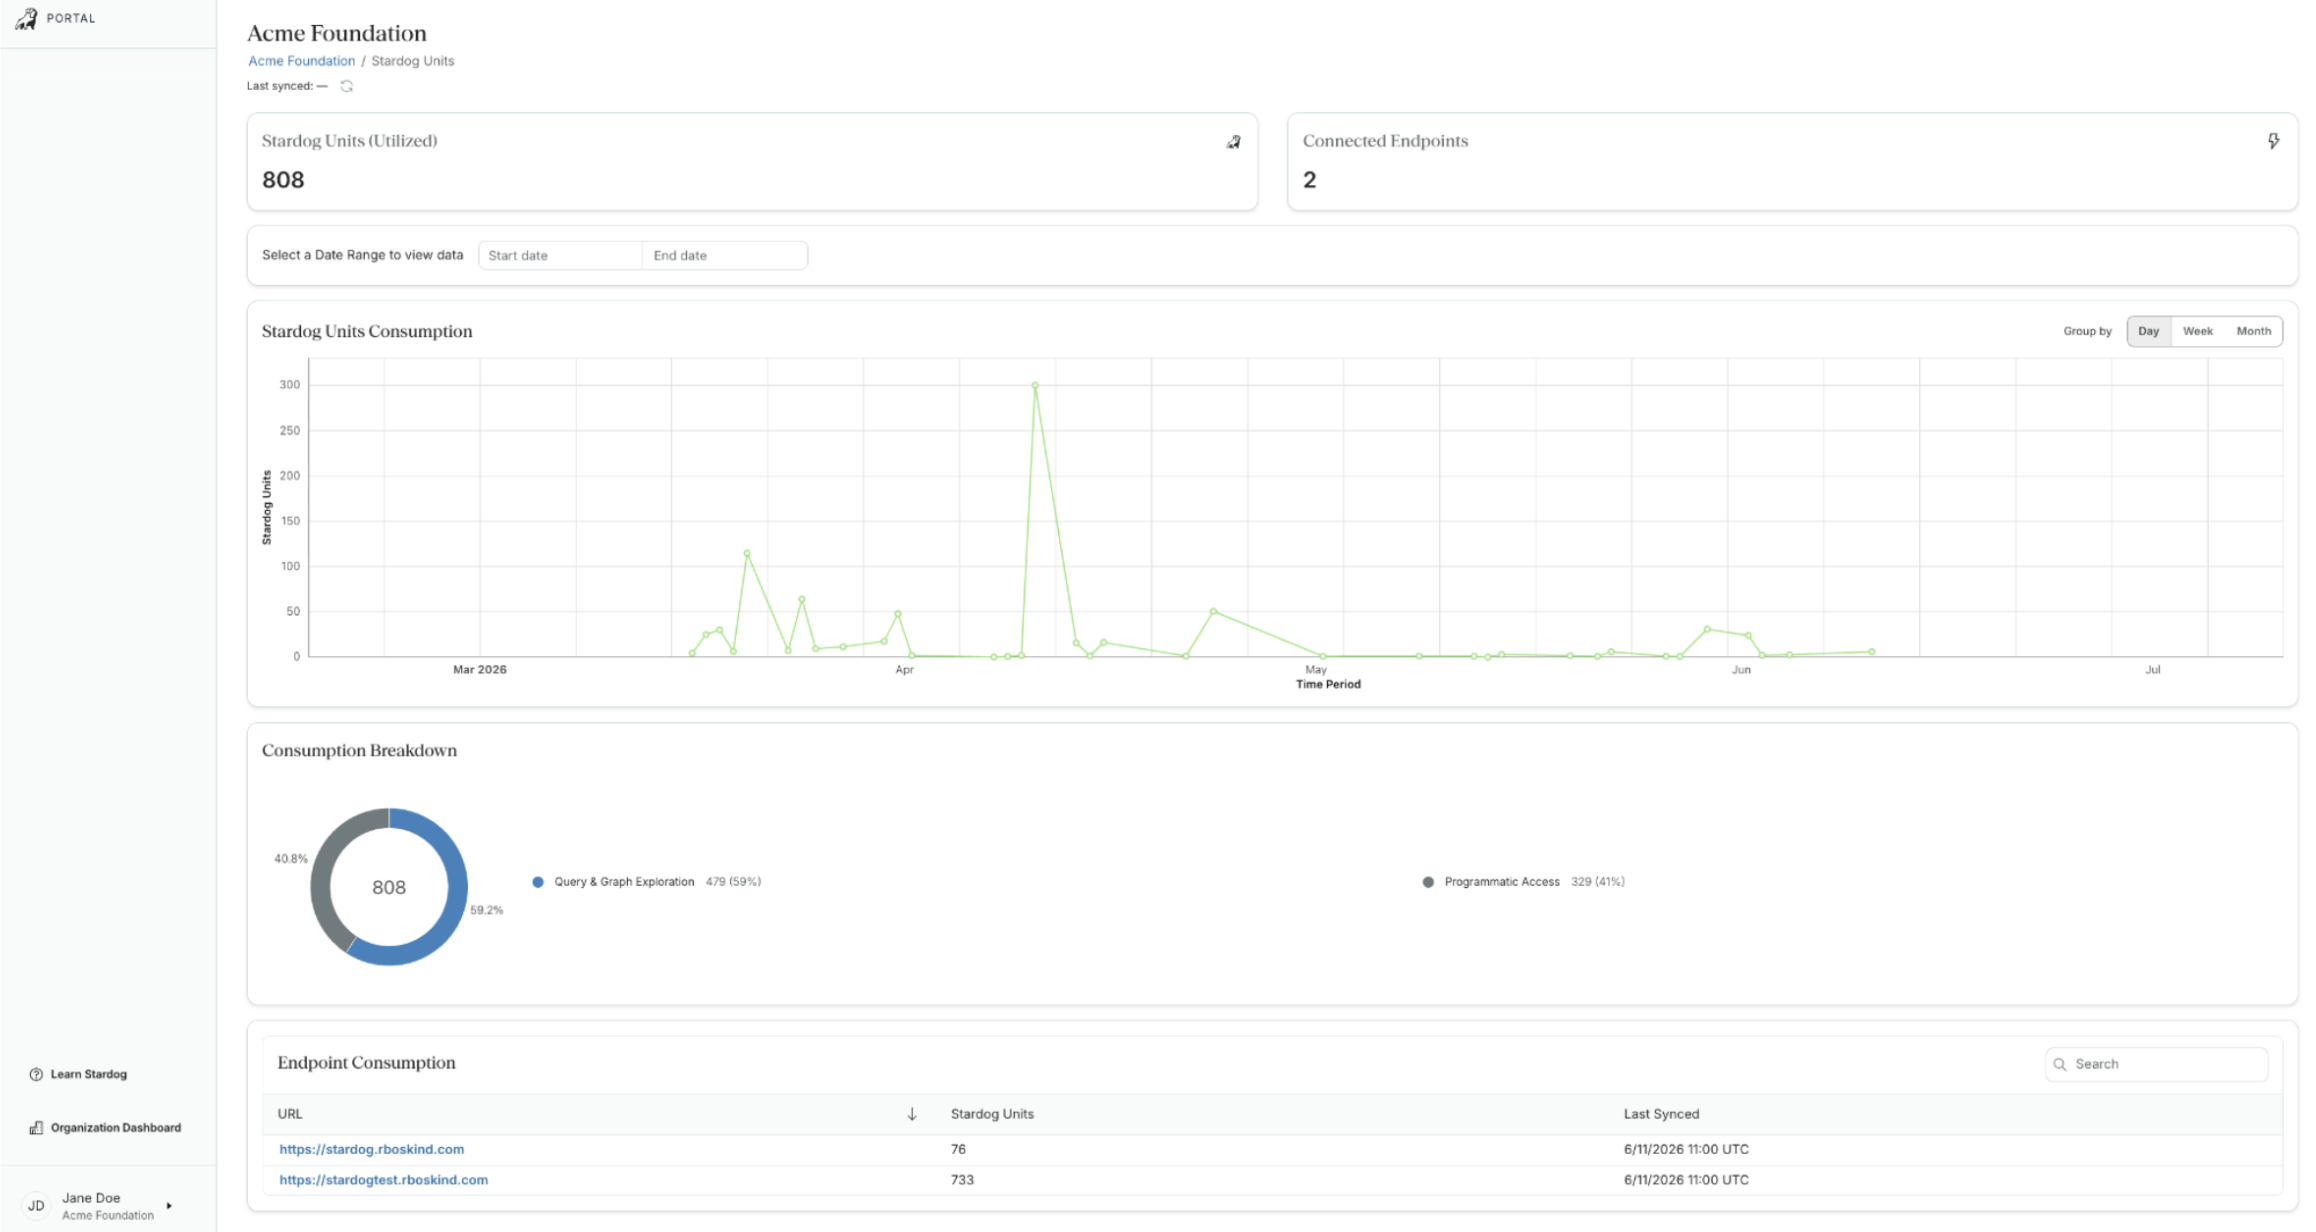
A Last synced timestamp and refresh icon are shown beneath the breadcrumb, indicating when usage data was last pulled. Click the Sync All icon to pull and refresh consumption metrics across the endpoints in the dashboard. 
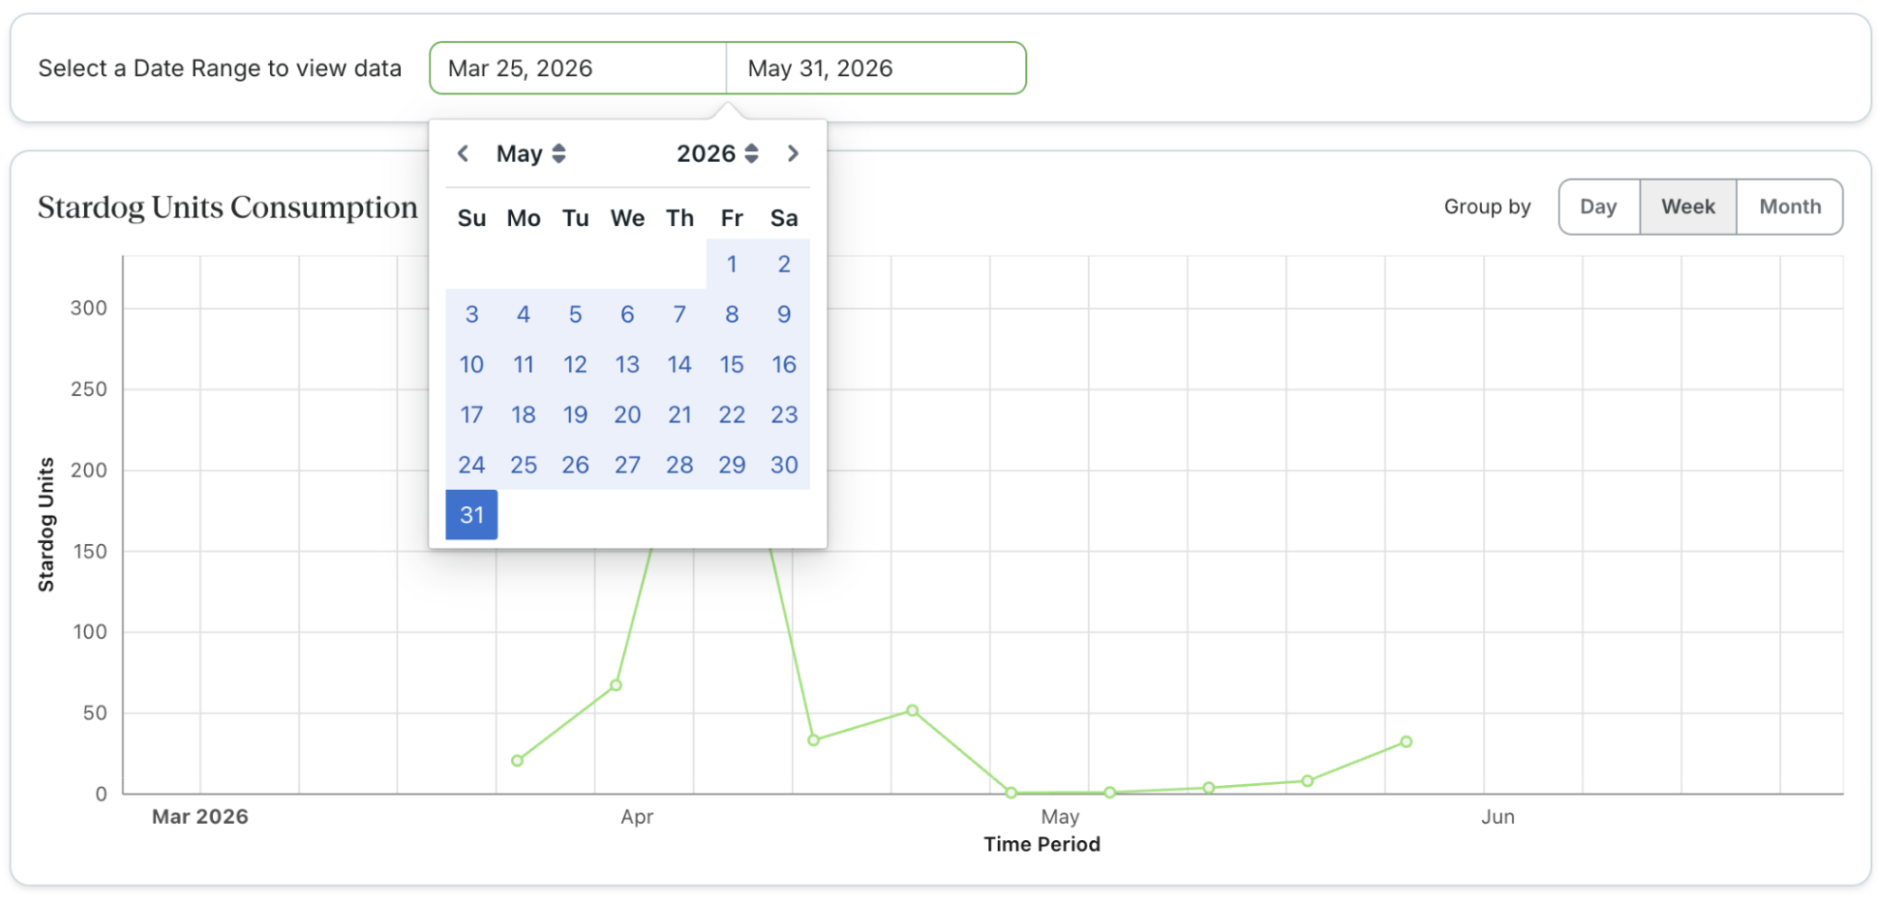
Date range selector: use the Start date and End date fields to filter all charts and tables to a specific period.
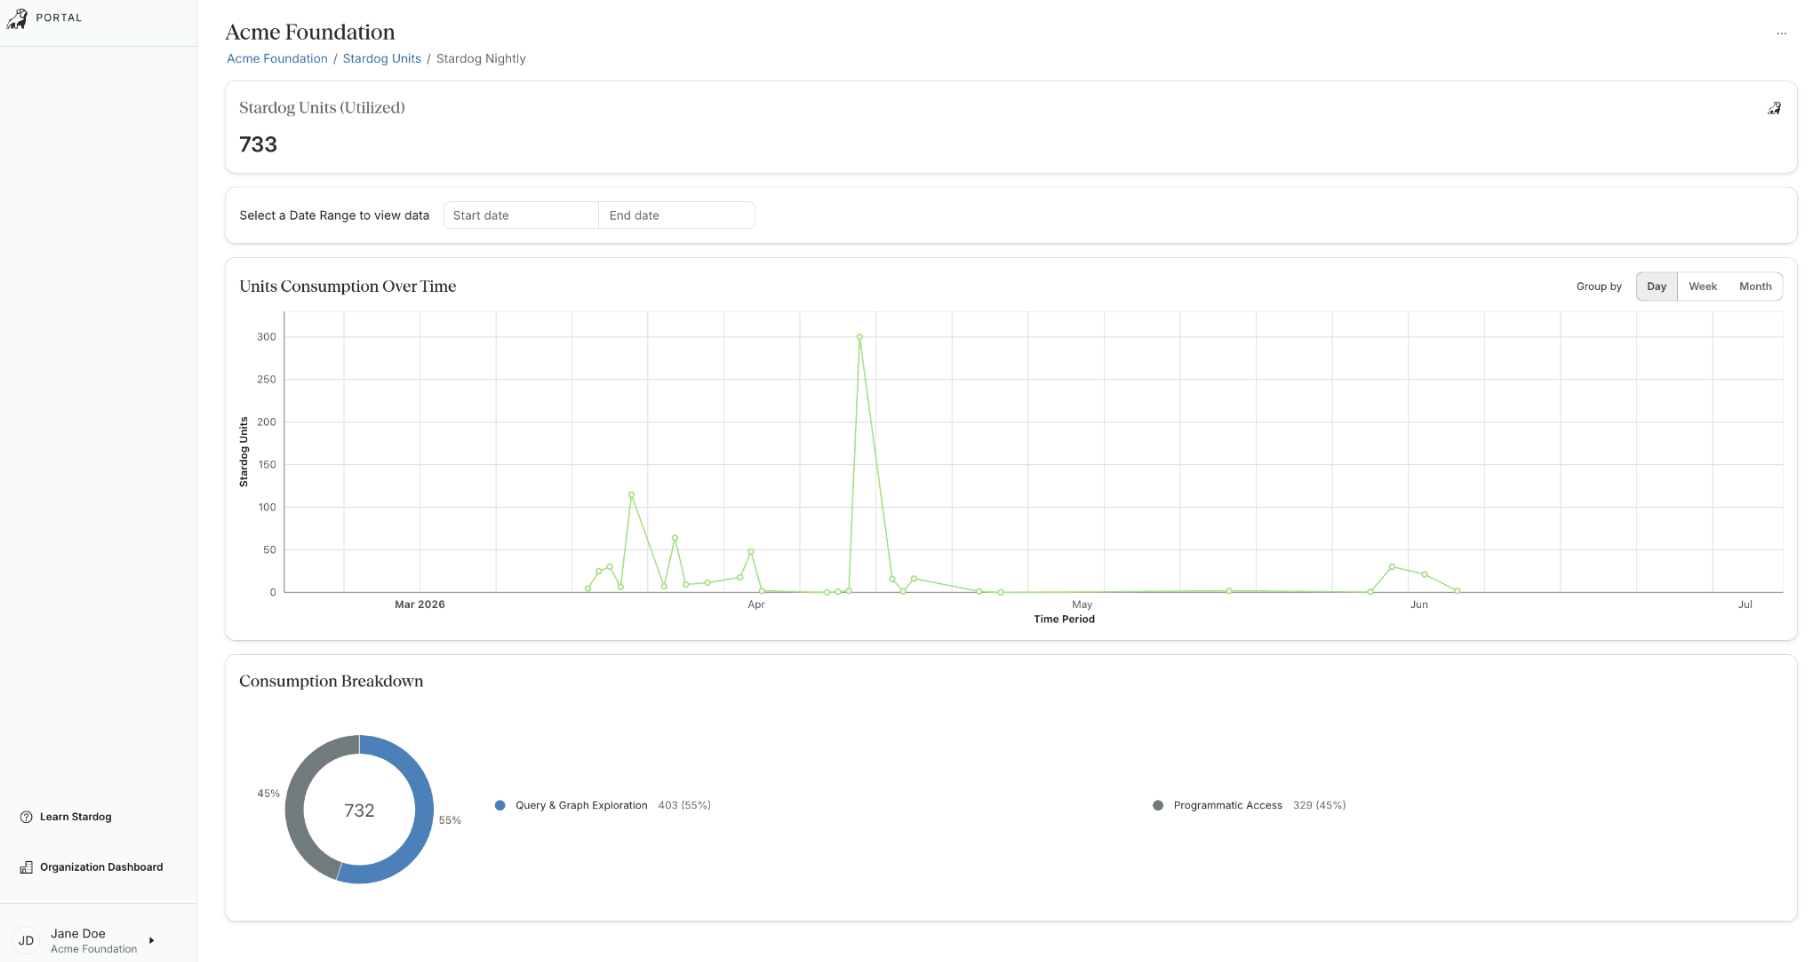
Stardog Units Consumption: a time-series line chart showing SDU consumption over the selected date range. Use the Group by toggle (Day / Week / Month) in the top-right of the chart to change the granularity of the visualization.
Consumption Breakdown: a donut chart showing the proportion of total consumption attributed to each consumption category. Each segment is labeled with the category name, its total SDU count, and its percentage of overall consumption. Consumption categories include the following:
- Data Modeling & Management: ontology design actions in Designer and adding/syncing data sources in the Knowledge Catalog
- Document Processing: processing and ingesting documents using BITES
- Natural Language Interactions: all Voicebox usage, including natural language interactions via the UI, public API, and AI-assisted model generation in Designer
- Programmatic Access: SPARQL/GraphQL queries and API operations executed by application code, scripts, SDKs, or the CLI. Also includes running External Compute tasks.
- Query & Graph Exploration: query execution in Studio, graph exploration and query builder queries in Explorer
Administrative actions, such as managing endpoints, users, and SSO, are not billed and do not appear here. 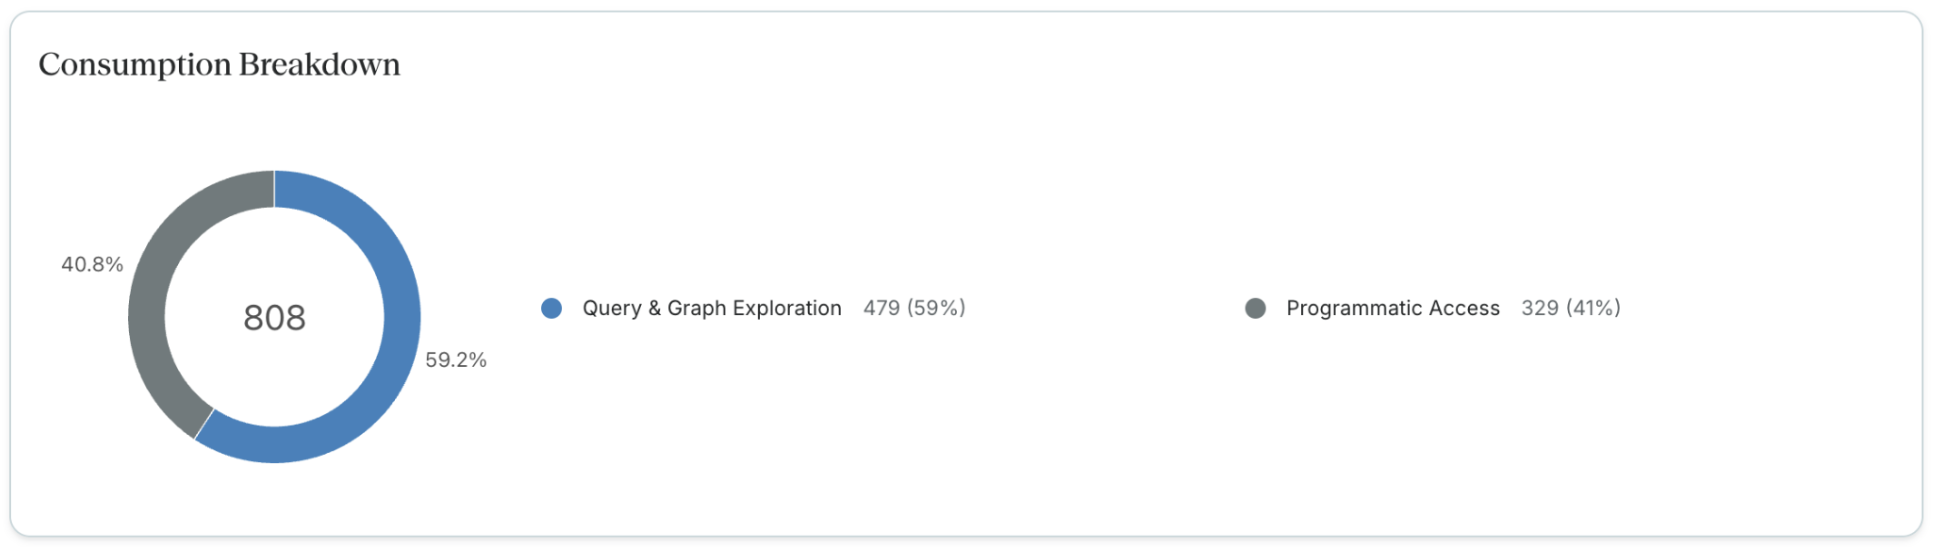
Endpoint Consumption: a table listing each endpoint alongside its individual SDU total and the timestamp of its last sync. Use the Search field to filter by endpoint URL. 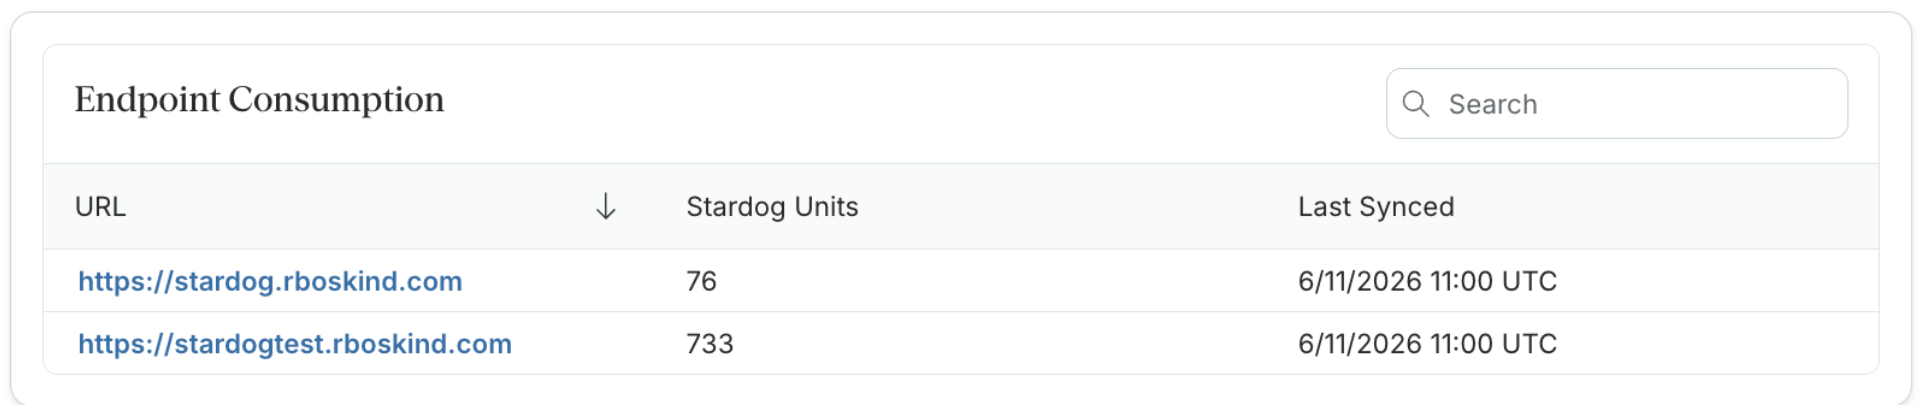
Endpoint Detail View: clicking a hyperlinked endpoint URL in the Endpoint Consumption table opens a detail page scoped to that endpoint. This view includes the same date range selector, consumption chart, and breakdown donut chart as the org-level view, filtered to the selected endpoint.
Visibility & Permissions: Endpoint detail views are hyperlinked and accessible only to users that have READ dbms-admin:logs permissions on the endpoint.
Usage Reports
To ensure your reports reflect the most recent data, you can perform two main actions: Syncing and Downloading.
Visibility & Permissions: The reporting options (Sync and Download) are accessible only to users that have
READ dbms-admin:logspermissions on the endpoint.Platform Requirements: Usage reporting requires Stardog Platform version 12 or higher. SDU tracking data is available to download after upgrading to Stardog 12. Downloaded reports do not cover retroactive usage (any consumption prior to the Stardog 12 upgrade will not appear in reports).
Syncing Usage Data
Syncing pulls the latest consumption data from your Stardog endpoint and prepares it for export. The sync process may take a few moments to complete.
- Navigate to your list of endpoints in Stardog Cloud.
- Locate the endpoint you wish to report on.
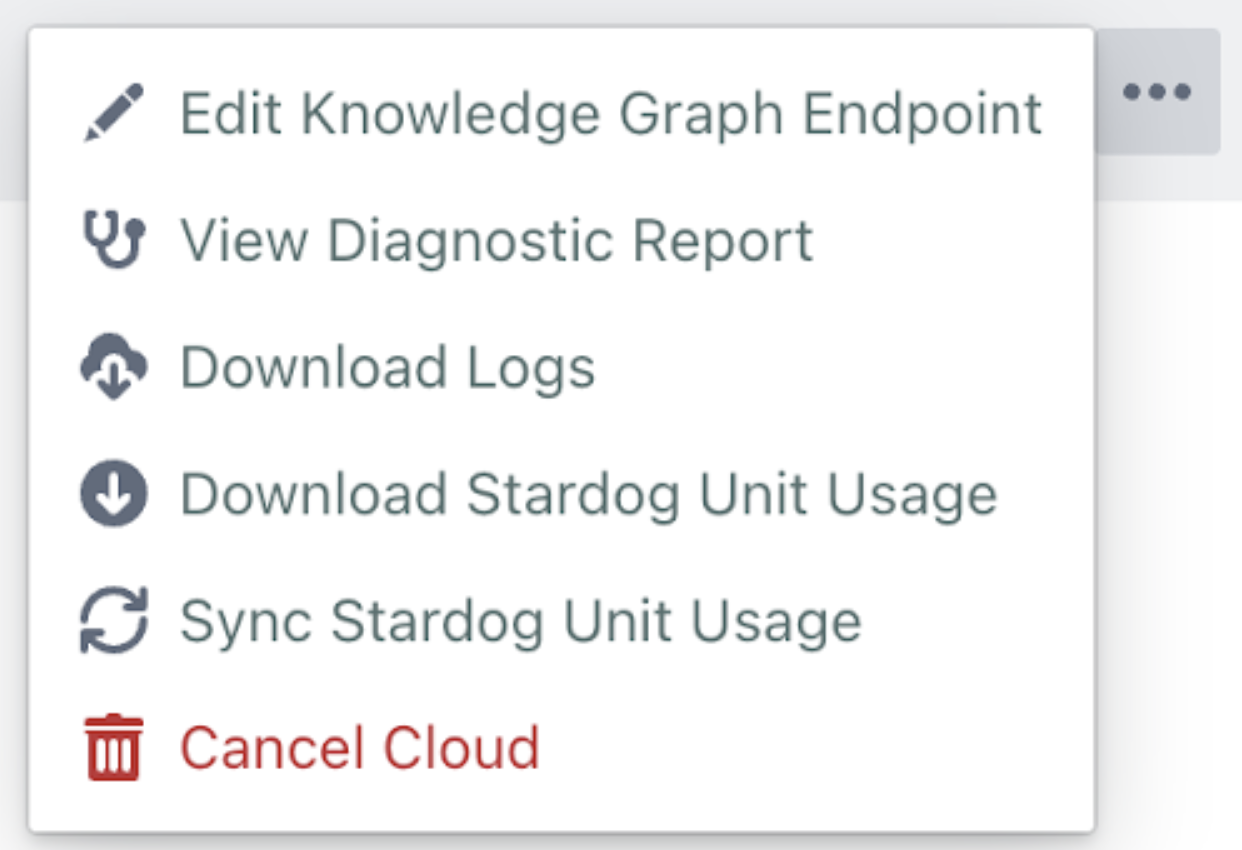
- Click the … (Actions) menu and select Sync Stardog Unit Usage.
Up-to-Date Data: If the Sync option is greyed out, your data is already up to date and you can proceed directly to downloading.
Downloading the CSV Report
Once the data is synced, you can export it as a CSV file for your records.
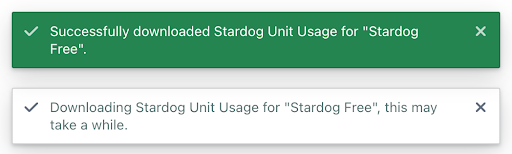
- Click the … (Actions) menu and select Download Stardog Unit Usage.
- The browser will automatically download a CSV file containing the aggregated daily SDU consumption for that endpoint.
Data Aggregation and Reporting Logic
- Endpoint-Level Aggregation: Usage is summed across all users of an endpoint into a single daily total.
- Daily Granularity: Each row in your exported CSV represents one 24-hour period of consumption.
- Remarks Field: This column captures any errors that may have occurred during that specific day’s aggregation process.
- Historical Data: If a sync has not been run recently, the download will reflect the data from the last successful sync.
- No Usage Found: Endpoints with no usage return a “no usage data found” notification instead of downloading an empty file.
- Data is aggregated daily at 1:30 AM UTC. A previous day’s usage will not be included if the full 24-hour window has not yet completed by the time of sync/download.
An example report downloaded on 2026-02-20 would look as follows:
| Date | Endpoint Name | Endpoint URL | Daily SDU Total |
|---|---|---|---|
| 2026-02-16 | acme-production | https://acmeproduction.stardog.cloud:5820 | 320.40 |
| 2026-02-17 | acme-production | https://acmeproduction.stardog.cloud:5820 | 225.15 |
| 2026-02-18 | acme-production | https://acmeproduction.stardog.cloud:5820 | 440.28 |
| 2026-02-19 | acme-production | https://acmeproduction.stardog.cloud:5820 | 315.00 |
| TOTAL | 1,300.83 |